Why the Crypto Market Is Down Today

The Total Crypto Market Cap (TOTALCAP) and the Bitcoin (BTC) price are trading inside ascending parallel channels. NEAR Protocol (NEAR) risks breaking down from a crucial support area.
Cryptocurrency investment firm Ark Invest posted a report stating that the smart contract network could generate $450 billion in annual revenue by 2030. The Binance BNB chain is working on a technology that would improve block performance by executing concurrent transactions. Finally, the host of CNBC’s Mad Money Jim Cramer stated that the market is now bullish.
TOTALCAP Trades in Bearish Pattern
The crypto market cap has traded in an ascending parallel channel since Jan. 23. Such channels are considered bearish patterns, meaning that they lead to breakdowns most of the time.
On Jan. 29, the price was rejected by the channel’s resistance line and fell to its support line. After attempting to initiate an upward movement, the price was rejected by the channel’s midline. If a breakdown occurs, the cryptocurrency market cap could fall to the 0.382 Fib retracement support level at $927 billion.

On the other hand, a breakout from the channel could take the crypto market cap to the next resistance at $1.14 trillion.
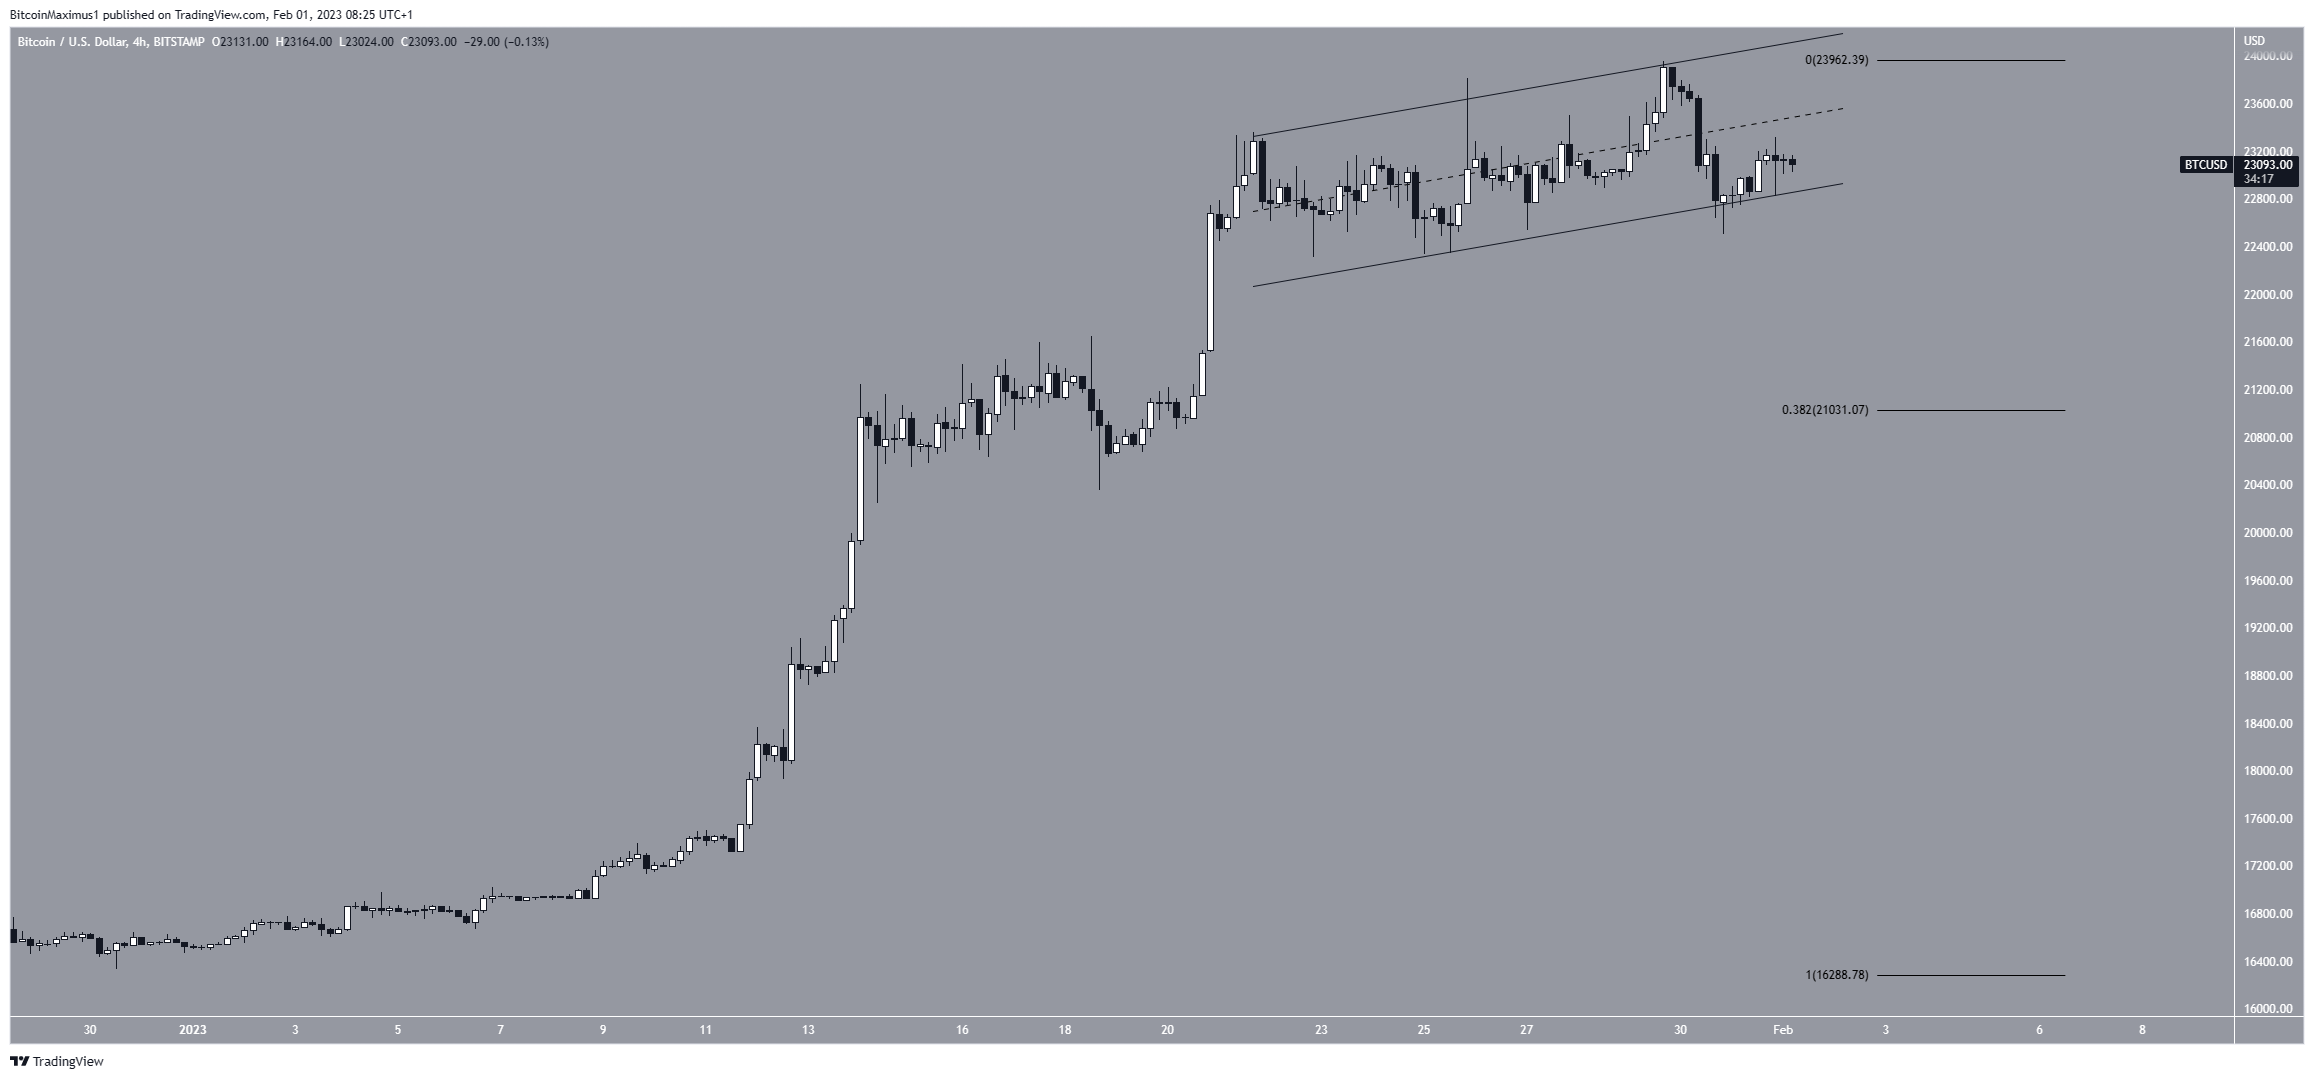
Bitcoin Could Break Down
Like the crypto market cap, the Bitcoin price has traded in an ascending parallel channel since Jan. 23. On Jan. 30, it saved a breakdown by bouncing at its support line. However, it failed to move above the channel’s midline and is now close to the support line once more.
If the Bitcoin price breaks down, it could fall to the 0.382 Fib retracement support level at $21,030.
On the other hand, an increase above the Jan. 29 highs of $23,960 would mean that the correction is complete and could take the BTC price to $24,500.
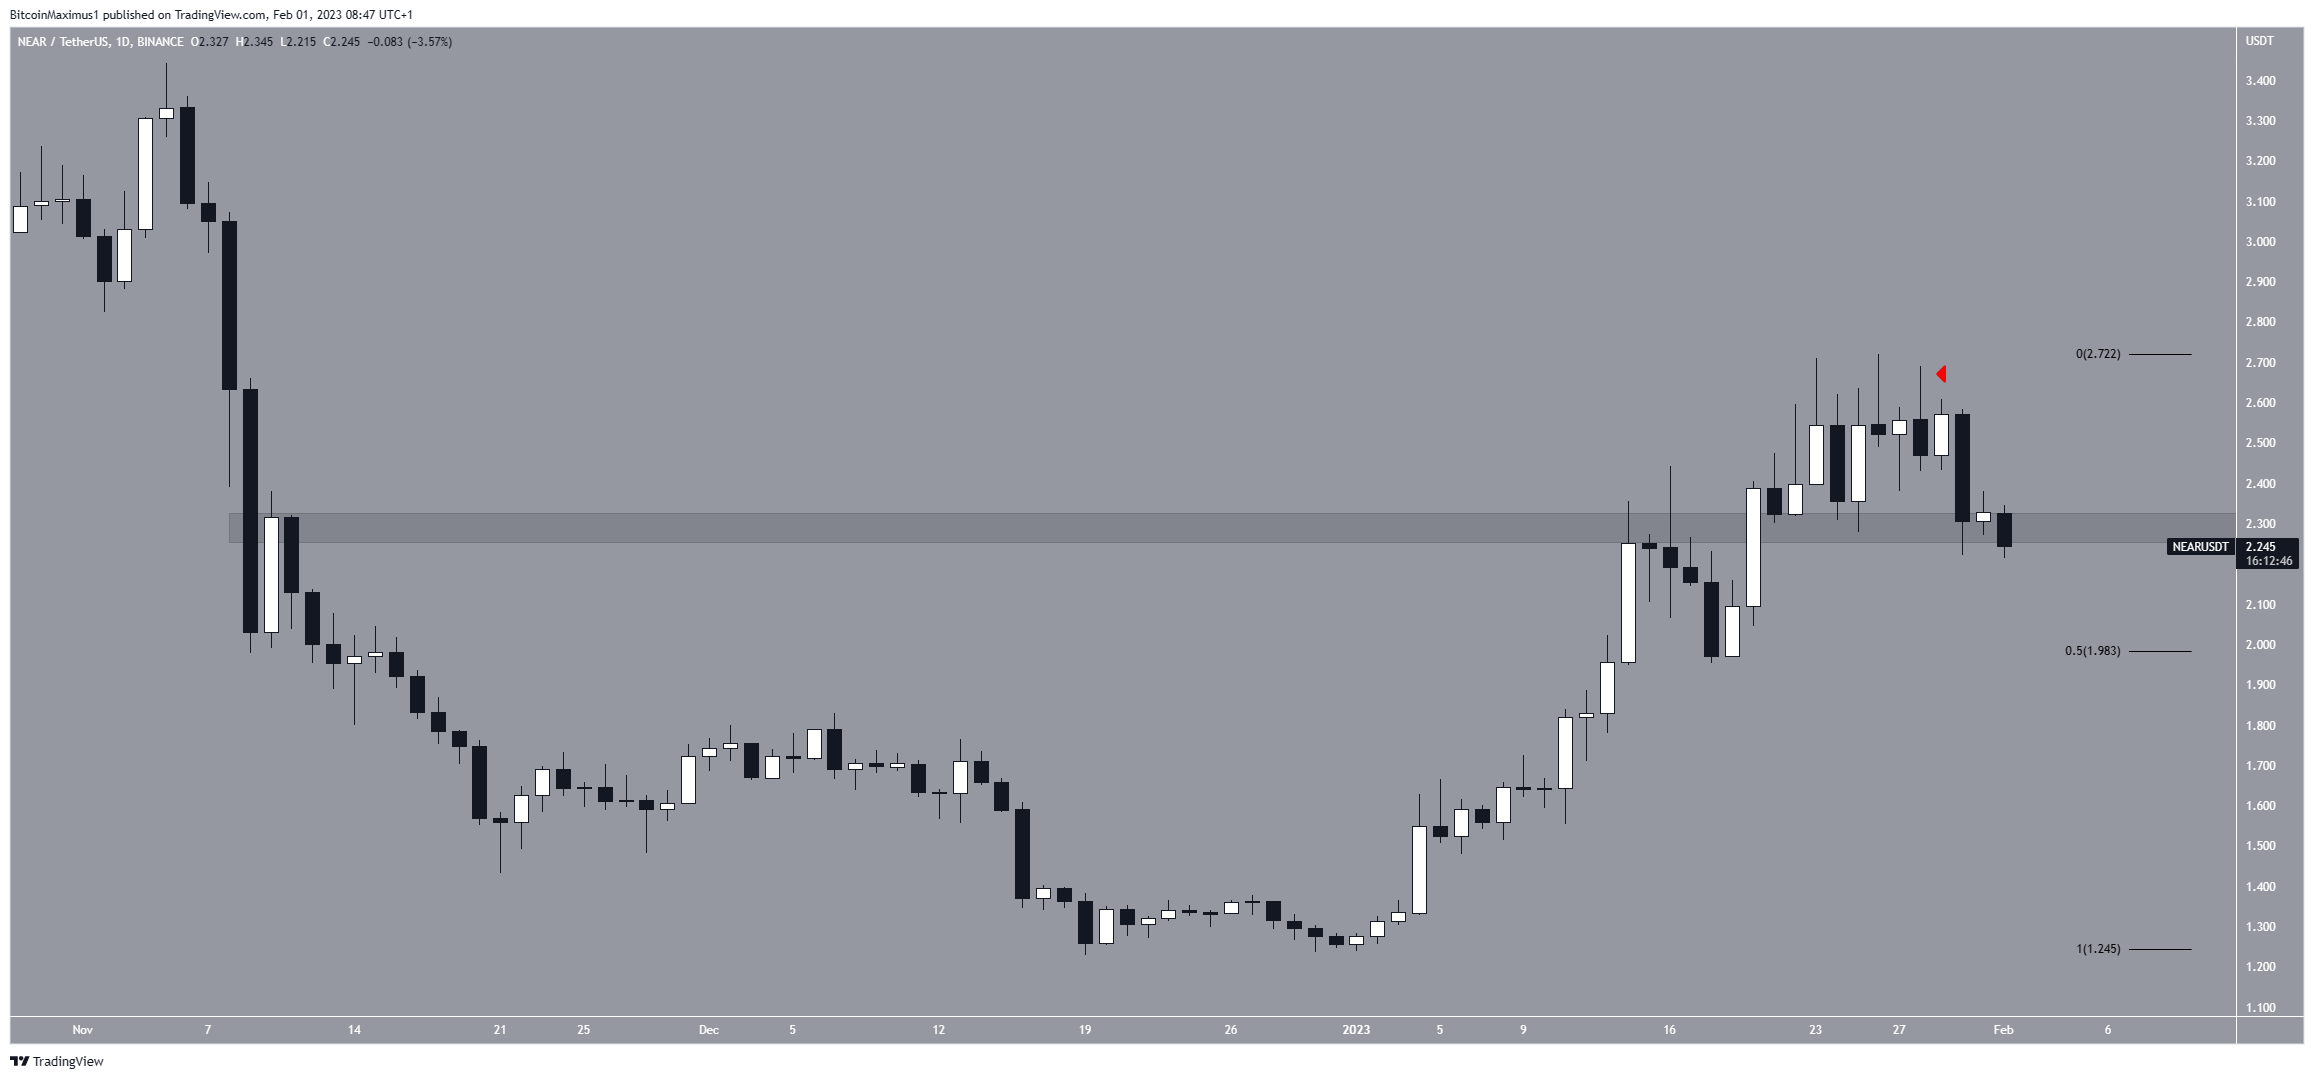
NEAR Risks Plunge
The NEAR price has increased since the beginning of the year. However, the rally began to lose steam on Jan. 23, creating numerous long upper wicks (red icon). The price created a bearish engulfing candlestick on Jan. 30.
Currently, the NEAR price is at risk of breaking down from the $2.29 horizontal support area. If it does that, it could fall to the 0.5 Fib retracement support level at $1.98.
On the other hand, a movement above the $2.72 highs could take the NEAR price to $3.35.
For BeInCrypto’s latest crypto market analysis, click here
Disclaimer
BeInCrypto strives to provide accurate and up-to-date information, but it will not be responsible for any missing facts or inaccurate information. You comply and understand that you should use any of this information at your own risk. Cryptocurrencies are highly volatile financial assets, so research and make your own financial decisions.